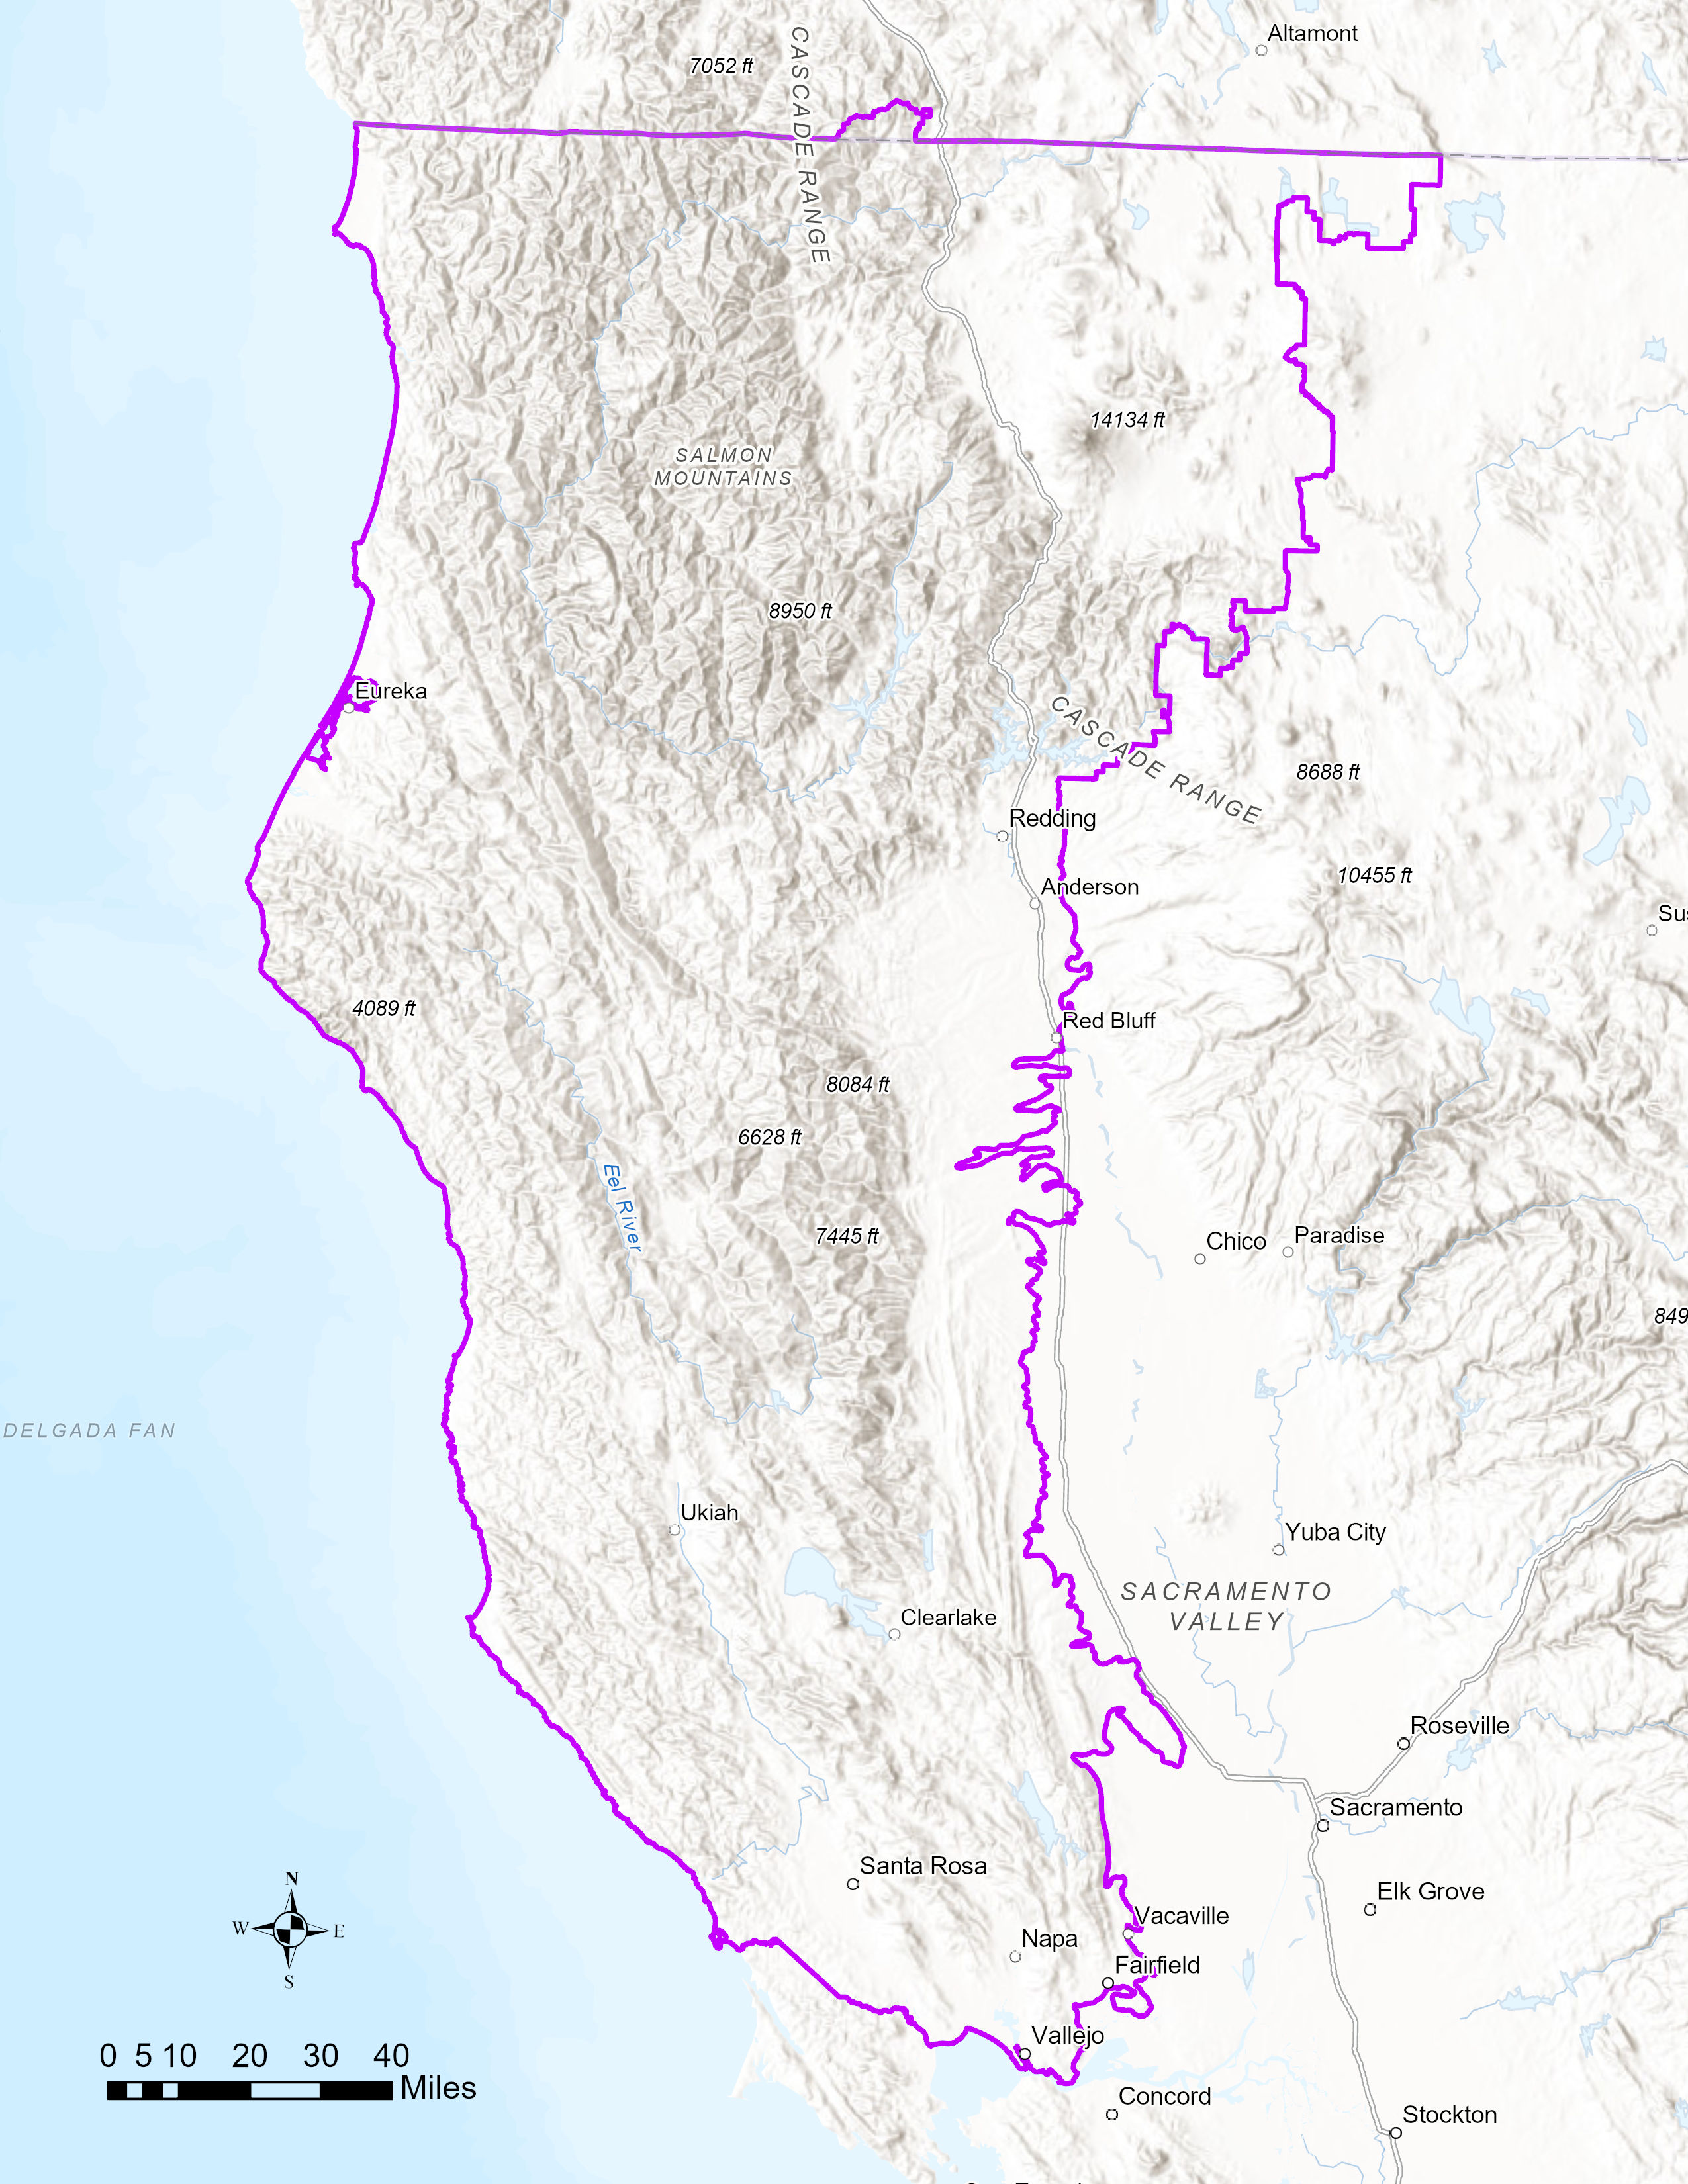
Northern California Regional Resource Kit
Purpose:
Reducing the risk of large, high intensity fire (and other mega-disturbances) through forest treatments has become a management imperative in California. A Strategy for Shared Stewardship (2018) and the USFS Wildfire Crisis Implementation Plan (2022) reinforce specific goals for pace and scale of strategic forest treatments over the next decade. Concurrently, the State of California has issued a new Wildfire and Forest Resilience Action Plan (2022), designed to strategically accelerate efforts to restore the health and resilience of California forests through a joint State of California - Forest Service framework to improve and enhance forest stewardship in California. The social incentives and the scientific knowledge to pursue meaningful restoration of forested landscapes in California are firmly established.
High quality geospatial data are an essential ingredient to address restoration/conservation of the broad suite of core socio-ecological values across landscapes, and to drive analytic tools for planning management investments. To support these initiatives an interagency team of scientists from the Forest Service/Pacific Southwest Research Station, California Natural Resources Agency/CALFIRE, and the University of California at Berkeley and University of California at Irvine collaborated on development of a comprehensive set of mapped data layers needed to accomplish large-scale landscape planning and restoration. Landscape level assessment using high quality data developed from ecological modeling techniques, informative analytical approaches and the resulting credible scientific outputs will be fundamental to inform and support large landscape restoration planning and execution.
The data layers included in this kit are meant to assist land managers in assessing their current landscape and plan for treatments to enhance resilience to human and natural disturbances. Thus each layer represents what the interagency team believes are the most relevant and reliable geospatial data available at this time. Each layer has been examined by the team and is supported by published data and/or was developed using standard methods. The methods for developing each layer are documented in the metric dictionary; however, the accuracy of each layer has not been quantified. It is anticipated that all data layers will be updated and refined as methods and source data evolve and improve.
Data Availability:
The Regional Resource Kit has adopted the "Framework for Resilience" to provide a structure for assessing landscape conditions, setting objectives, designing projects, and measuring progress towards social-ecological resilience. There are ten pillars that represent the desired outcomes of landscape resilience. Each of the pillars provide a series of metrics (the data layers) for assessing landscape conditions and verifying that actions meet resilience objectives.
Metrics describe the characteristics of elements in quantitative or qualitative terms. Users can use metrics to assess, plan for, measure, and monitor progress towards desired outcomes and greater resilience.
Data Access:
A total of 99 metrics are now available for download. Most data layers are available at 30 m resolution (i.e. pixels are 30 meters on a side), some are available at the resolution of the original data set (e.g. the climate refugia data are 270 meter pixel resolution).
Each data layer is available for viewing via downloading an image and the full data can also be downloaded as a zip file. In addition, the metadata are available for download. Links for all are located immediately adjacent to the listing of the data layer below under each of the ten pillars.
Use Constraints:
These data were collected from multiple sources, some which have specified use constraints. All data developed by the U.S. Government can be used without additional permissions or fees. Data developed by other sources may have other constraints. Please check each metric and their source to determine if any additional disclaimers exist. A full list of disclaimers by organization is available at the end of this webpage.
Appropriate use includes regional assessments of vegetation cover, land cover, or land use change trends, total extent of vegetation cover, land cover, or land use change, and aggregated summaries of vegetation cover, land cover, or land use change. Further use includes applying these data to assess management opportunities for treatments to restore landscape resilience using GIS software and specialized Decision Support Tools.
There are use disclaimers and restrictions for specific data layers. Please review the information below under "Data Credit and Disclaimers" (at the end of this document) and consult any specifics for each metric when downloading data.
Data Products:
The metrics are organized by the 10 pillars of resilience in the "Framework for Resilience" . Each pillar represents a resource outcome associated with resilient forest landscapes. There are 99 metrics within the resource kit that span the 10 pillars. The Metrics describe the characteristics of the elements (key characteristics) of each pillar in quantitative or, in a few cases, qualitative terms. Metrics are used to assess, plan for, measure, and monitor progress toward desired outcomes and greater resilience. Metrics are selected to be informative, meaningful, and actionable to meet the needs of management.
The metrics are also divided into three "tiers." Among all these metrics, some are created and relevant statewide. Other metrics are more suited to conditions within a given region. The “Tiers" for metrics included in each RRK:
Tier 1 - metrics that are a single, consistent data layer, developed statewide; they can also be clipped to the boundary of the region so values within that region are the only ones included for calculations or regional statistics. Example: Annual Burn Probability.
Tier 2 - metrics relevant to a single region or relevant to multiple Regions but data layers differ among Regions because of varied data availability (sources) across Regions. Example: California gnatcatcher habitat suitability.
Tier 3 - metrics are those that would be of interest to some land managers for specific applications but not included as a core metric in an RRK. Example: Distribution of the Quino checkerspot butterfly.
Each RRK will contain all Tier 1 and Tier 2 data together to comprise the kit. Tier 3 data will be pointed to for reference and use, as needed.
The addition of new metrics will be designated by noting as "new" . Similarly there could be data layers that have been removed. Users should check the previous version and compare with this version to identify layers removed.
Some data layers within this kit contain null values. We point this out here so users of the data will be aware and take whatever measures appropriate as they use and analyze the data. For some raster datasets in the RRK, areas have been masked (blanked) out and have a cell value of NoData (also referred to as null, NaN or missing). We, as producers and users of the data, cannot ignore NoData or fill them with zeros, since zero is often a valid value for some datasets. Removing NoData cells is not an option, a raster is a continuous grid. For users of the data performing further analyses and combining or "stacking" rasters, these NoData cells will mask out all values in that location in the output. To avoid this issue, the user must create values for the cells before combining them (i.e. 999 or any numeric value that is not real and clearly out of the range of the other values). Reasons for masking (blanking) out cells in RRK data:
- Cells are lakes or reservoirs
- Cells are urban or agriculture
- Cells contain no information relevant to the dataset (i.e. streams, habitat)
- Area (cells) subject to fire or other disturbance but the post disturbance condition or value is unknown
The metrics included are listed below In Brown by Pillar. After each metric in parentheses is the source of the data, followed by links to a map, a brief description, and a download of the spatial data.
CLEAN AIR IS IMPORTANT to human health and wellness, clean water, biodiversity, and ecosystems. Catastrophic wildfires degrade air quality and cause respiratory illnesses that affect millions of people, especially children and people who work outdoors. Furthermore, people prefer to enjoy the outdoors when it is safe to breathe, and the skies are clear. Smoke from wildfires discourages recreation and disrupts businesses and local economies. Land managers seek to improve forest health and resilience by using prescribed fire to reduce the risk of uncharacteristic fire and smoke.
OUTCOME: Emissions from fires are limited to primarily low- and moderate-severity fires in wildland ecosystems. Forests improve air quality by capturing pollutants.
Particulate Matter
BIODIVERSITY PLAYS A MAJOR ROLE in our ecosystems and society. Native plants and animals help forests recover after a fire, control flooding and soil erosion, and cycle nutrients. Biodiversity also holds cultural value, including Native American uses, and provides recreational benefits like birdwatching. Greater species diversity promotes adaptability and helps ecosystems withstand and recover from disturbances, including those caused by a changing climate.
OUTCOME: The network of native species and ecological communities is sufficiently abundant and distributed across the landscape to support and sustain their full suite of ecological and cultural roles.
Species Diversity
Focal Species
Community Integrity
CARBON SEQUESTRATION IS THE PROCESS by which carbon dioxide is taken up by trees, grasses, and other plants and stored as carbon in biomass and soils. Resilient forests and wetlands can be net sinks of carbon and can play an important role in reducing greenhouse gas emissions into the atmosphere, thereby mitigating climate change. Forest products also play a role in storing carbon for decades in building materials, thereby delaying emissions.
OUTCOME: Carbon sequestration is enhanced in a stable and sustainable manner that yields multiple ecological and social benefits.
Storage
Stability
ECONOMIC DIVERSITY INCREASES business opportunities that provide regional economic vitality and additional benefits to rural and vulnerable populations. Resilient forests provide ecosystem services and forest products that in turn provide a foundation for many local and regional economic activities and employment opportunities, including recreation, tourism, and natural resource management industries.
OUTCOME: Forest management and outdoor activities support a sustainable, natural-resource-based economy, particularly in rural communities.
Wood Product Industry
DUE TO CLIMATE CHANGE and other drivers, wildfires increasingly threaten homes and communities, especially in the wildland-urban interface. Fire adapted communities are knowledgeable and engaged. They accept fire as part of the surrounding landscape, take action to reduce their vulnerability to fire, and adapt to live safely with fire.
OUTCOME: Communities have adapted to live safely in forested landscapes and understand the significance of fire to maintaining healthy forests. They have sufficient capacity to manage desired fire and suppress unwanted fire.
Hazard
FIRE IS AN INTEGRAL PART of northern California forest ecosystems, which are evolutionarily adapted to fire. Ideally prescribed fires and managed wildfires would be allowed to burn across the landscape periodically. They would burn primarily at low to moderate severity in a mosaic pattern that covers large areas, which would provide substantial ecological benefits. Because climate change generally increases the severity of fire dynamics, managing such dynamics will continue to grow in importance.
OUTCOME: Fire burns in an ecologically beneficial and socially acceptable way that perpetuates landscape heterogeneity and rarely threatens human safety or infrastructure.
Functional Fire
Severity
RESILIENT FORESTS AND SHRUBLANDS PROVIDE many ecosystem services, including wildlife habitat, clean water, stable soils, recreational opportunities, biodiversity, wood products, and carbon sequestration. They also play an important role in both mitigating and adapting to climate change. Across the landscape, management activities and natural disturbances should maintain desired forest conditions, including forest heterogeneity and wildlife habitat.
OUTCOME: Vegetation composition and structure align with topography, desired disturbance dynamics, and landscape conditions, and are adapted to climate change.
Structure
Composition
Disturbance
A GROWING BODY OF EVIDENCE indicates that greater exposure to nature is associated with better health and well-being. Forests in the northern California Region allow people to build and maintain active cultural and social connections to a place. Resilient landscapes offer opportunities for people to connect with the natural environment through recreation experiences, culturally valued resources, and engagement in natural resource management and conservation.
OUTCOME: The landscape provides a place for people to connect with nature, to recreate, to maintain and improve their overall health, and to contribute to environmental stewardship, and is a critical component of their identity.
Equitable Opportunity
Recreation Quality
- TBD
WETLANDS PROVIDE critical habitat, filter and retain nutrient pollution, store carbon, enhance water quality, control erosion, and provide spaces for recreation. They are local and regional centers of biodiversity, and support species found nowhere else across western landscapes. Functional wetland ecosystems will serve increasingly important roles in buffering impacts from extreme climate events, and upland disturbances such as flooding and erosion.
OUTCOME: Meadow and riparian ecosystems provide multiple ecosystem services and are key linkages between upland and aquatic systems in forested landscapes.
Composition
Operational Data Layers Provided:
Fire
Terrestrial
Aquatic
Administrative
Land designations (US Forest Service)
Metric Dictionary:
These data have been assembled in one place to provide comprehensive access for land managers. Accompanying all the data is a metric dictionary which provides details on the nature of each metric. Each metric has been defined to help end-users of the data (and for use with any decision support tools) to understand:
- What tier is the metric in (1, 2, or 3)?
- Data vintage
- The definition meant by a given metric
- The expected use(s) of the metric
- The resolution of the developed data
- The data sources used to derive the metric
- The method of metric derivation
- The root file names
References have been included to help the reader understand potential methods for deriving metrics. It is our hope this information will help people make better use of all the assembled information and how it can best be used with various decision support tools. This dictionary will be updated periodically, as necessary.
Access to the Northern California Regional Resource Kit Metric Dictionary .
Data Credits and Disclaimers:
-
USDA Forest Service Use Constraints - The USDA Forest Service makes no warranty, expressed or implied, including the warranties of merchantability and fitness for a particular purpose, nor assumes any legal liability or responsibility for the accuracy, reliability, completeness, or utility of these geospatial data, or for the improper or incorrect use of these geospatial data. These geospatial data and related maps or graphics are not legal documents and are not intended to be used as such. The data and maps may not be used to determine title, ownership, legal descriptions or boundaries, legal jurisdiction, or restrictions that may be in place on either public or private land. Natural hazards may or may not be depicted on the data and maps, and users should exercise due caution. The data are dynamic and may change over time. The user is responsible to verify the limitations of the geospatial data and to use the data accordingly.
-
USDA Forest Service Distribution Liability - The USDA Forest Service manages resource information and derived data as a service to users of USDA Forest Service digital geographic data. The USDA Forest Service is in no way condoning or endorsing the application of these data for any given purpose. It is the sole responsibility of the user to determine whether or not the data are suitable for the intended purpose. It is also the obligation of the user to apply those data in an appropriate and conscientious manner. The USDA Forest Service provides no warranty, nor accepts any liability occurring from any incorrect, incomplete, or misleading data, or from any incorrect, incomplete, or misleading use of these data.
USDA Forest Service - Region 5 and Pacific Southwest Research Station (PSW)
USFS Rocky Mountain Research Station (RMRS)
USDA Forest Service, Pacific Northwest Research Station, Forest Inventory and Analysis Program - use of F3 or derived products should include the following FIA citation: Burrill, Elizabeth A.; Wilson, Andrea M.; Turner, Jeffery A.; Pugh, Scott A.; Menlove, James; Christensen, Glenn; Conkling, Barbara L.; David, Winnie. 2018. The Forest Inventory and Analysis Database: database description and user guide version 8.0 for Phase 2. U.S. Department of Agriculture, Forest Service. 946 p. [Online]. Available at web address: Burrill et al. 2018 .
-
Pyrologix
- Primary data contact: James Newman (California State BLM
Office) jnewman@blm.gov
The user must be aware of data conditions and must ultimately bear responsibility for the appropriate use of the information with respect to possible errors, possible omissions, map scale, data collection methodology, data currency, and other conditions specific to certain data.
This 2022 dataset is an update produced by Pyrologix for the Bureau of Land Management (BLM) California State Office. The original 2020 dataset was developed by Pyrologix for the USFS Pacific Southwest Region. Citation for this data is in the References section below.
-
Center for Ecosystem Climate Solutions (CECS) - UC Irvine - The University of California ("UC") makes the materials on this website available pursuant to the following disclaimers: the materials are offered "as is"; user assumes any and all risks, of any kind or amount, of using these materials; user shall use the materials only in accordance with law; user releases, waives, discharges and promises not to sue UC, its directors, officers, employees or agents, from liability from any and all claims, including the negligence of UC, resulting in personal injury (including death), accidents or illnesses, property loss, as well as any and all loss of business and/or profit in connection with user's use of the materials; and user shall indemnify and hold UC harmless from any and all claims, actions, suits, procedures, costs, expenses, damages, and liabilities, including attorney's fees, arising out of user's use of the materials and shall reimburse UC for any such incurred expenses, fees or costs.
The CECS data layers may be used under comparable terms. The specific data use license is a Creative Commons BY-SA agreement.
-
California Department of Fish and Wildlife - The state makes no claims, promises, or guarantees about the accuracy, completeness, reliability, or adequacy of these data and expressly disclaims liability for errors and omissions in these data. No warranty of any kind, implied, expressed or statutory, including but not limited to the warranties of non-infringement of third-party rights, title, merchantability, fitness for a particular purpose, and freedom from computer virus, is given with respect to these data.
The ACE data is subject to certain assumptions and limitations that must be considered in any use or application of the data. All ACE data layers are limited by the accuracy and scale of the input data. ACE is a compilation of the best available scientific information; however, many of these datasets are not comprehensive across the landscape, may change over time, and should be revised and improved as new data become available.
The user accepts sole responsibility for the correct interpretation and use of these data and agrees not to misrepresent these data. CDFW makes no warranty of any kind regarding these data, express or implied. By downloading these datasets, the user understands that these data are in draft condition and subject to change at any time as new information becomes available. The user will not seek to hold the State or the Department liable under any circumstances for any damages with respect to any claim by the user or any third party on account of or arising from the use of data or maps. CDFW reserves the right to modify or replace these datasets without notification.
The ACE maps display biological and recreational values based on available data and constrained by the limitations of the data. The values may be influenced by level of survey effort in a given area. The ACE data represent broad-scale patterns across the landscape, and the value of any single watershed should be interpreted with caution. ACE is a decision-support tool to be used in conjunction with species-specific information and local-scale conservation prioritization analyses.
The ACE maps do not replace the need for site-specific evaluation of biological resources and should not be used as the sole measure of conservation priority during planning. No statement or dataset shall by itself be considered an official response from a state agency regarding impacts to wildlife resulting from a management action subject to the California Environmental Quality Act (CEQA).
Biogeographic Information and Observation System (BIOS). Use of this dataset requires prior approval by the primary contact. Recognition that the data set was created and provided by the California Department of Fish and Wildlife, and that any questions regarding the data should be addressed to the contact person listed in the metadata.
-
California Department of Water Resources - Groundwater basins and subbasins are defined by the California Department of Water Resources as last modified by the Basin Boundary Emergency Regulation adopted on October 21, 2015. The file is in ESRI geodatabase format and is intended for use with compatible GIS software. Groundwater basins are represented as polygon features and designated on the basis of geological and hydrological conditions - usually the occurrence of alluvial or unconsolidated deposits. When practical, large basins are also subdivided by political boundaries, as in the Central Valley. Basins are named and numbered per the convention of the Department of Water Resources. The associated data are considered DWR enterprise GIS data, which meet all appropriate requirements of the DWR GIS Spatial Data Standards. DWR makes no warranties or guarantees, either expressed or implied, as to the completeness, accuracy or correctness of the data, nor accepts or assumes any liability arising from or for any incorrect, incomplete or misleading subject data.
-
Data Basin - Data Basin, by the Conservation Biology Institute (CBI), is a public resource of user-contributed data about conservation issues. Any content including datasets, files, logos, and documents contributed by the user and any resulting data generated by such user belongs to the user, and CBI makes no claim to this content nor does CBI provide any warranty to this content whatsoever. The Data Basin platform itself, and all related documentation, design, and graphic elements (the website as a whole) are the proprietary property of CBI, and CBI possesses all right and title. All of these Data Basin platform rights are reserved.
Disclaimer CBI makes no warranty or guarantee as to the content, sequence, accuracy, timeliness, or completeness of any of the information provided herein. CBI explicitly disclaims any representations and warranties of merchantability and fitness for a particular purpose. CBI shall assume no liability for any errors, omissions, or inaccuracies in the information provided regardless of how caused. CBI would appreciate feedback on any errors that are discovered when using this site by contacting us at databasin@consbio.org .
Use rights Data Basin has the ability to allow users to browse and search in the Service. You may upload your own data for use within the Data Basin platform; however, this use is limited to only non-commercial purposes. You may not use this site or information found at this site for selling or promoting products or services, soliciting clients, or any other commercial purpose. You may not share your sign-in or password with anyone. You may reproduce, publish, and/or display portions of the Data Basin content only as is necessary to display data for your non-commercial purpose and only if you (1) cite CBI as the owner of Data Basin and (2) abide by any use constraints in citing third-party data. CBI waives any and all liability with respect to unauthorized uses of third-party data. As the user of third-party data, you represent and warrant that you have secured rights in that data and that you will indemnify CBI for any unauthorized use of the data. CBI reserves the sole discretion and right to deny, revoke, or limit use of this site at any time.You may not copy, reproduce, publish, display, make derivative works from, or reverse engineer the Data Basin platform or the Content. You understand and agree that the Service, including all new features provided with the Service, is provided "AS-IS" and that the Provider assumes no responsibility for any content, user communications or personalization settings. You are responsible for obtaining access to the Service and that access may involve third party fees (such as ISP charges). In addition, you must provide and are responsible for all equipment necessary to access the Service.
For additional details see https://databasin.org/pages/terms-service/
-
Farmland Mapping and Monitoring Program - The State of California and the Department of Conservation make no representations or warranties regarding the accuracy of these data or maps. Neither the State nor the Department shall be liable under any circumstances for direct, indirect, special, incidental or consequential damages with respect to any claim by any user or any third party on account of or arising from the use of these data or maps.
This data does not reflect general plan or zoning designations, city limit lines, changing economic or market conditions, or other factors which may be taken into consideration when land use policies are determined. This data is not designed to be used for parcel specific planning purposes due to its scale and the size of the minimum mapping unit (10 acres).
-
LANDFIRE - LF data are provided "as-is" and without express or implied warranties as to their completeness, accuracy, suitability, or current state thereof for any specific purpose. The LF Program is in no way condoning or endorsing the application of these data for any given purpose. The DOI and USFS manage multiple sets of information and derived data as a service to users of digital geographic data and various databases. No agent of LF shall have liability or responsibility to data users or any other person or entity with respect to any loss or damage caused or alleged to be caused directly or indirectly by the data set. Any use of trade, product, or firm names is for descriptive purposes only and does not imply endorsement by the U.S. government.
-
National Marine Fisheries Service NOAA - NOAA Fisheries' science-based conservation and management of sustainable fisheries, marine mammals, endangered species, and their habitats have become global models for marine stewardship and sustainability. Our research surveys provide data critical to the stewardship of our nation's ocean resources and their habitat. For 150 years, our scientists and partners have collected survey data to understand current and changing ocean conditions and monitor marine life. The insights we gain are the heart of our science-based conservation and management. The NOAA datasets made available through NOAA Open Data Dissemination( NODD) are free for all users to access with no use restrictions and do not require any registration to access. The data is fully open for public access and can be downloaded with no egress charges.
-
University of California Davis - The University of California ("UC") makes the materials on this website available pursuant to the following disclaimers: the materials are offered "as is"; user assumes any and all risks, of any kind or amount, of using these materials; user shall use the materials only in accordance with law; user releases, waives, discharges and promises not to sue UC, its directors, officers, employees or agents, from liability from any and all claims, including the negligence of UC, resulting in personal injury (including death), accidents or illnesses, property loss, as well as any and all loss of business and/or profit in connection with user's use of the materials; and user shall indemnify and hold UC harmless from any and all claims, actions, suits, procedures, costs, expenses, damages, and liabilities, including attorney's fees, arising out of user's use of the materials and shall reimburse UC for any such incurred expenses, fees or costs.
-
University of California Department of Agriculture and Natural Resources - The California's Forest Products and Biomass Power Plant facilities is a resource developed through a collaborative effort of UC Cooperative Extension to monitor and analyze wood utilization capacity throughout the state of California.
We maintain current information on capacity, development, and status of facilities accepting feedstock from California wood resources. On this page you will find an interactive map and summary table of wood intake facilities. Here you can find a list of local community biomass initiatives and working groups . We also provide a variety of print-ready maps and raw data for download with assistance from the USFS.
This effort is built on contributions from the California Biomass Collaborative, California Energy Commission, California Public Utilities Commission, California Forestry Association, National Renewable Energy Laboratory, Biomass Power Association, California Biomass Energy Alliance, California Energy Almanac, University of Montana, Watershed Research and Training Center, and individual facilities. We appreciate the feedback and input from Tad Mason and Fred Tornatore at TSS Consultants and Rob Williams from the UC Davis California Biomass Collaborative. Funding support is provided by the California Department of Forestry and the USFS Region 5 State and Private Forestry.
User to verify all information. May contain errors and omissions. Please reference Woody Biomass Utilization Group if using this data.
-
Office of Environmental Health Hazard Assessment, CAL EPA - The CalEnviroScreen 4.0 model is based on CalEPA's definition of cumulative impacts. The model is based on geography, specifically census tracts in California. It presents information for the entire state. The State makes no claims, promises, or guarantees about the accuracy, completeness, reliability, or adequacy of these data and expressly disclaims liability for errors and omissions in these data. No warranty of any kind, implied, expressed, or statutory, including but not limited to the warranties of non-infringement of third party rights, title, merchantability, fitness for a particular purpose, and freedom from computer virus, is given with respect to these data.
-
Open Data Commons - Open Data Commons is not a law firm and does not provide legal services of any kind. Open Data Commons has no formal relationship with you. Your receipt of this document does not create any kind of agent-client relationship. Please seek the advice of a suitably qualified legal professional licensed to practice in your jurisdiction before using this document. No warranties and disclaimer of any damages. This information is provided 'as is', and this site makes no warranties on the information provided. Any damages resulting from its use are disclaimed.
-
Open Street Map - This data is made available under the Open Database License: http://opendatacommons.org/licenses/odbl/1.0/ . Any rights in individual contents of the database are licensed under the Database Contents License: http://opendatacommons.org/licenses/dbcl/1.0/. OSM data are free to copy, distribute, transmit and adapt. OpenStreetMap® is open data, licensed under the Open Data Commons Open Database License (ODbL) by the OpenStreetMap Foundation (OSMF).
-
California Natural Resources Agency, CALFIRE - The State of California and the Department of Forestry and Fire Protection make no representations or warranties regarding the accuracy of data or maps. The user will not seek to hold the State or the Department liable under any circumstances for any damages with respect to any claim by the user or any third party on account of or arising from the use of data or maps. The user will cite the Department of Forestry and Fire Protection as the original source of the data, but will clearly denote cases where the original data have been updated, modified, or in any way altered from the original condition.
-
U.S. Fish and Wildlife Service - The use of trade, product, industry or firm names is for informative purposes only and does not constitute an endorsement by the U.S. Government or the Fish and Wildlife Service. Links to non-Service Web sites do not imply any official U.S. Fish and Wildlife Service endorsement of the opinions or ideas expressed therein or guarantee the validity of the information provided. Base cartographic information used as part of the Wetlands Mapper has been provided through a license agreement with ESRI and the Department of the Interior.
-
U.S. Geological Survey - Unless otherwise stated, all data, metadata and related materials are considered to satisfy the quality standards relative to the purpose for which the data were collected. Although these data and associated metadata have been reviewed for accuracy and completeness and approved for release by the U.S. Geological Survey (USGS), no warranty expressed or implied is made regarding the display or utility of the data for other purposes, nor on all computer systems, nor shall the act of distribution constitute any such warranty.
-
SALO Sciences Inc. - Neither we, the Collaborators, nor our licensors or suppliers make any representations or warranties concerning any content contained in or accessed through the Services, and we will not be responsible or liable for the accuracy, copyright compliance, legality, or decency of material contained in or accessed through the Services. We (and our licensors and suppliers) make no representations or warranties regarding suggestions or recommendations of services or products offered or purchased through the Services. THE SERVICES AND CONTENT ARE PROVIDED ON AN “AS-IS" BASIS, WITHOUT WARRANTIES OR ANY KIND, EITHER EXPRESS OR IMPLIED, INCLUDING, WITHOUT LIMITATION, IMPLIED WARRANTIES OF MERCHANTABILITY, FITNESS FOR A PARTICULAR PURPOSE, NON-INFRINGEMENT, OR THAT USE OF THE SERVICES WILL BE UNINTERRUPTED OR ERROR-FREE. SOME STATES DO NOT ALLOW LIMITATIONS ON HOW LONG AN IMPLIED WARRANTY LASTS, SO THE ABOVE LIMITATIONS MAY NOT APPLY TO YOU.
The user is responsible to verify the limitations of the geospatial data and to use the data accordingly. For all data layers, please check each data source and adhere to any limitations established by the data creator. In general, adhere to the terms for use listed at the bottom of this paragraph.
The authors make no warranty, expressed or implied, including the warranties of merchantability and fitness for a particular purpose, nor assumes any legal liability or responsibility for the accuracy, reliability, completeness, or utility of these geospatial data, or for the improper or incorrect use of these geospatial data. These geospatial data and related maps or graphics are not legal documents and are not intended to be used as such. The data and maps ay not be used to determine title, ownership, legal descriptions or boundaries, legal jurisdiction, or restrictions that may be in place on either public or private land. Natural hazards may or may not be depicted on the data and maps, and land users should exercise due caution. The data are dynamic and may change over time.
- Attribution - You must give appropriate credit, provide a link to the license, and indicate if changes were made. You may do so in any reasonable manner, but not in any way that suggests the licensor endorses you or your use.
- ShareAlike - If you remix, transform, or build upon the material, you must distribute your contributions under the same license as the original.
- Non-Commercial Use Only - Some data layers are restricted by the terms of the data provider. “Non-commercial purposes" means that you may not sell, profit from, or commercialize the content within or works derived from them. Carefully review the terms of each data provider before using the data.
- No additional restrictions - You may not apply legal terms or technological measures that legally restrict others from doing anything this license permits.